Steve Keen develops this model to demonstrate how a dynamic macroeconomic model can be derived from some macroeconomic definitions. Neoclassical economists assume the only way to describe an economic system is to extrapolate from microeconomic descriptions. In this video, Keen uses five macroeconomic definitions to define three relationships. He then differentiates these, builds a model using those equations, and demonstrates what happened in 2008.
The three equations are the change in employment rate, the wages share of output, and the private debt to output ratio. By differentiating the equations with respect to time, it transforms the equations to represent dynamic relationships between the elements. Figure 1 shows the equations created by the model.
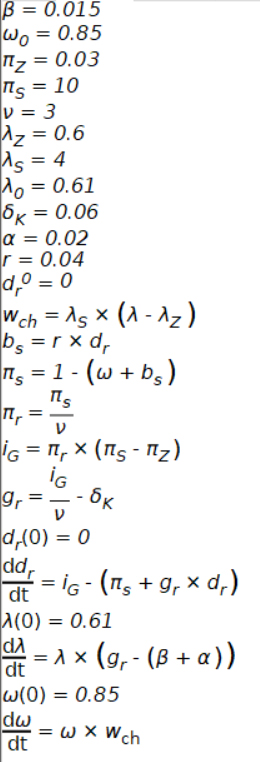
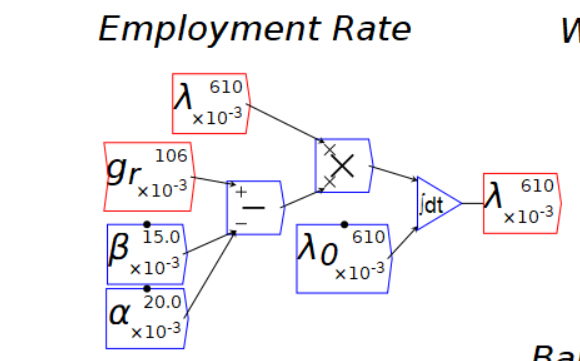
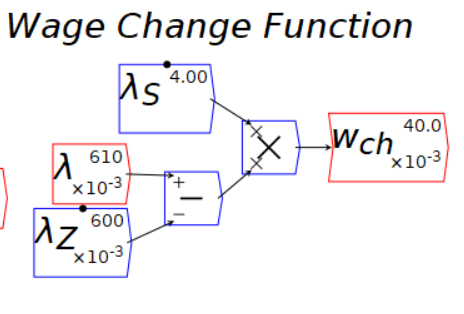
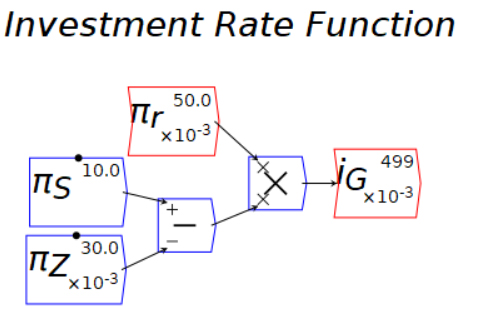
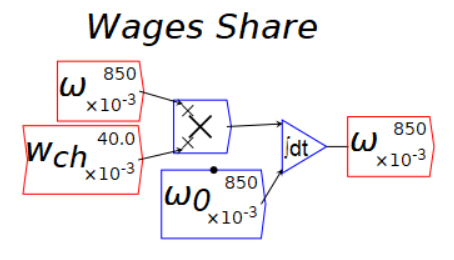
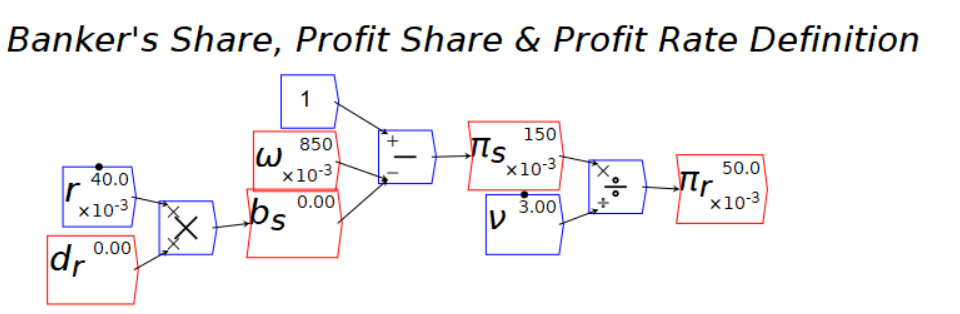
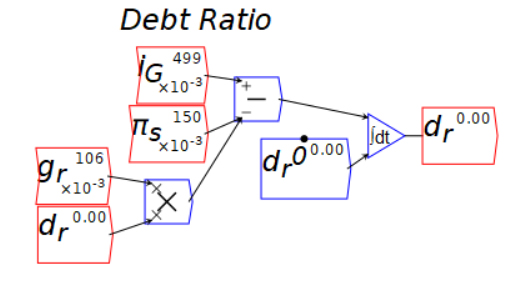
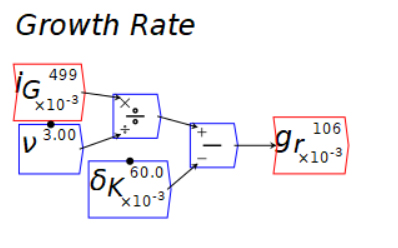
The Minsky wiring diagrams are easier to understand. Figures 2 through 8 are elements of the model as seen through the wiring diagrams.
The tutorial I created doesn’t describe some of the graphing techniques used. The normal Minsky graphs use time as the x axis. Minsky has the option of using a different variable for the x axis. Figure 9 shows the graphs generated by running the model.
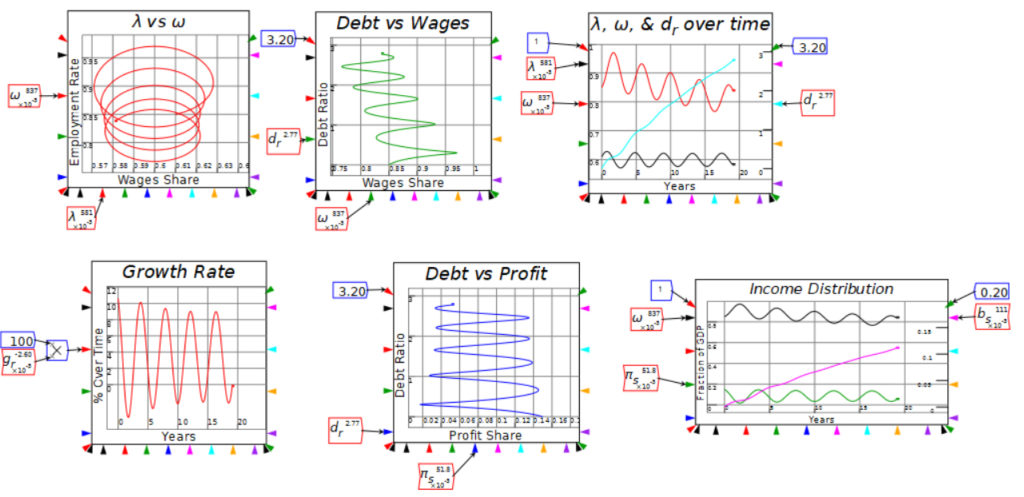
The graphs show convergent behavior. However, running the graph another 31 years shows divergence. Keen says this divergent behavior is what happened in 2008. Private debt overwhelmed the system. Figure 10 shows the model after 50 years.
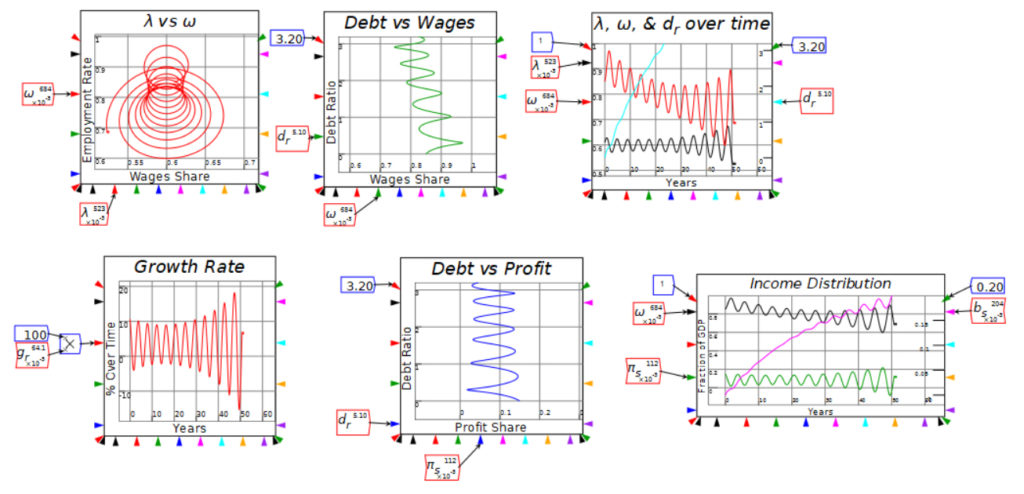
Notice that the growth rate becomes more extreme. The employment rate relative to wages share of GDP swings wider. Wage rate and employment rate swings become more extreme. The economy is not stable.